The "P to F interval" is the period between the initial ability to detect a potential failure (P) and the functional failure (F).
Some assets fail randomly or suddenly. But many assets degrade predictably, due to use, age and wear. Such assets often provide detectable symptoms that a failure is about to occur. If we can measure the asset to detect such symptoms, and if there is enough time before the upcoming failure occurs, we can do something about it - we will be able to perform predictive maintenance.
Predictive maintenance involves measuring the "condition" of the asset and performing a corrective action if it falls outside condition limits. As such, it is often known as on-condition or condition-based maintenance.
Continuous monitoring & machine learning provides us with an advanced method for predicting functional failures. However, most predictive maintenance is managed via inspection tasks and subsequent corrective action.
To implement a successful predictive maintenance strategy, we must be able to schedule a regular inspection of the function or known symptoms, where the inspection interval is economically viable, will predict the upcoming functional failure before it occurs and still leave enough time to schedule a corrective action. We can analyze the inspection interval and lead-time for corrective actions via the P-F interval.
Potential & Functional Failures
The "P to F interval" in RCM refers to the period between the initial ability to detect a potential failure (P) and the actual functional failure (F).
P (Potential Failure): This represents the point in time when there are detectable indications or symptoms that a failure is impending. During this stage, there may be signs or signals that the equipment is starting to degrade, but it has not yet reached a functional failure.
F (Functional Failure): This is the point at which the equipment can no longer perform its intended function within specified performance standards or criteria. It is the moment when the failure becomes apparent and may result in downtime or other adverse consequences.
Quantitative Functions
When defining the functions and functional failures in the FMEA, if we provided functions with measurable performance standards, we will have an objective functional failure - the defined function will fail if it falls outside the measurable limits.
Example
This is best shown with an example.
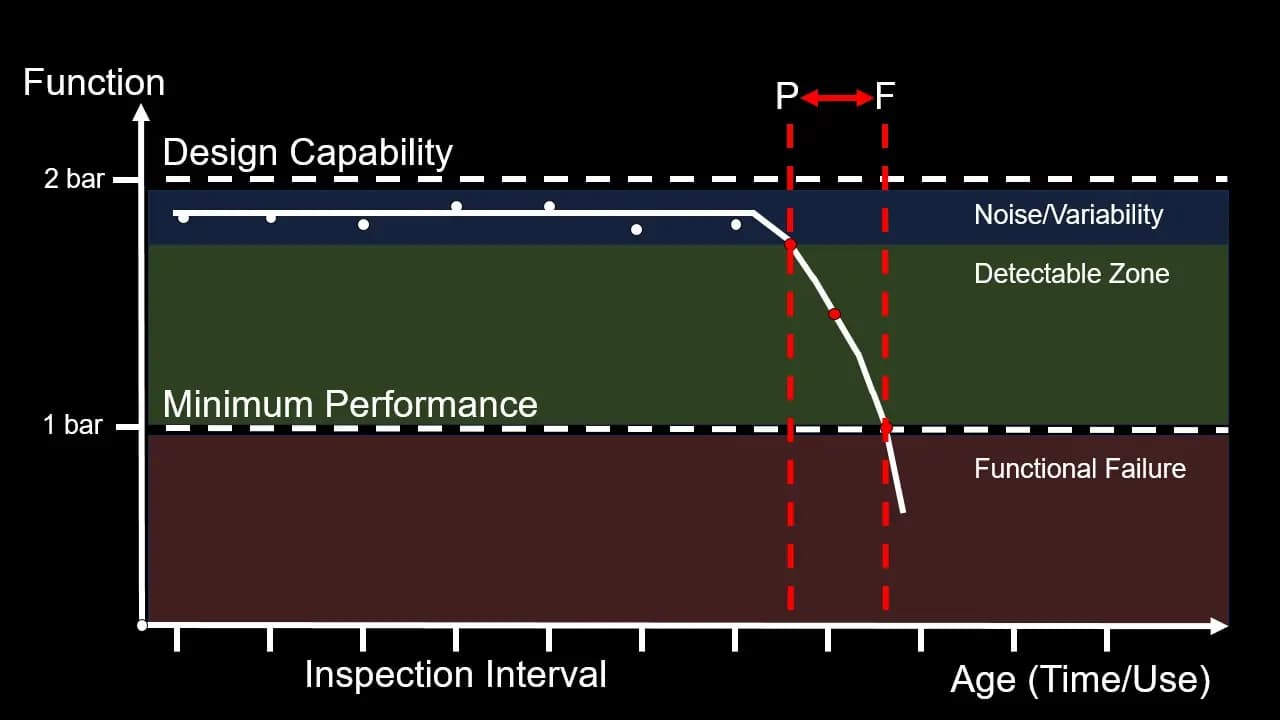
Imagine a chilled water system that is used to cool a power plant. In this system, we have a pump - our asset. The function of this pump, in this system, is to maintain a pressure of 1 bar. The manufacturer's specification states it can handle up to 2 bar - so this is the asset's capability. But importantly, our function's performance limit is just 1 bar of pressure. If it falls below 1 bar, we have a functional failure.
As the pump ages, its capability will degrade. It can no longer maintain 2 bar of pressure, but it can still provide more than 1 bar, the function we require. As it ages further, it will continue to degrade, until it can't even provide 1 bar of pressure. We have hit our functional failure, and may experience significant consequences.
However, the pump's ability to maintain pressure, its function, follows a predictable pattern.
The initial degradation indicates a potential failure. We are seeing symptoms that a failure is occurring or about to occur. To have a successful predictive maintenance strategy, we must be able to detect a potential failure. In this case, we can detect when we have a pressure reading that is below our operating pressure and outside normal equipment variability and measurement noise.
After that initial degradation, failure is not instantaneous. We have a period where the asset degrades further with age, until it reaches functional failure. This period, between the ability to detect a potential failure and the point when the asset fails to fulfil its required function (Functional Failure) is the P to F interval.
So, to perform predictive maintenance, we need two things:
- The ability to detect a potential failure
- A long enough interval between detection and the functional failure
Corrective Action
Such predictive maintenance requires two maintenance tasks:
- An inspection task to perform and record the measurement
- A corrective action task to replace or restore the asset before it degrades to functional failure
The inspection task is usually scheduled at a given interval, either based on time (e.g. once a month) or usage (e.g. every 10,000 miles).
The corrective task is usually more involved, and may require an experienced engineer, spare parts or specialist resources. You may not be able to schedule the corrective task instantaneously.
The P to F interval must be larger than the inspection interval, and still leave lead-time for the corrective action.
Many modern assets provide their own measurements and can alert you when the potential failure has been reached. Or you may set up your own continuous monitoring system to do it. This is still predictive maintenance, but now the inspection task is automated and has an effective interval of zero. The P to F interval is still important though, as you still need sufficient time to schedule the corrective action.
The P-F Curve & Complex Analysis:
A P-F interval is only useful if it provides a reliable prediction. Conventional wisdom and common-sense should be avoided, prediction requires analysis. The simplest analysis is to monitor a single dimension degrade over time. In the example above, the single dimension is the pump's capacity to maintain pressure, which we can map against time, producing a P-F curve.
However, the P-F curve is but one example of such an analysis - the simplest example (one dimension). The P-F interval works with any symptoms that can be detected that provide a confident prediction of future failure. Often, these symptoms will be due to several dimensions degrading over time, in what can be a complex interrelated process.
Analyzing complex interrelated dimensions can be very tricky. But simple empirical observations can provide reliable predictions. For example, it may be noticed that an engine always fails after producing a recognizable vibration signature. The exact mechanism from vibration signature to failure may not be known, but if there is enough evidence to link the two, we have a P-F interval (but no curve).
Machine learning takes the above one step further. By supplying historic data of many different dimensions (e.g. temperature, vibration, humidity, etc.) and details of failure events, the ML can determine symptoms that predict future failure, and again, we have a P-F interval.