Scheduled preventative maintenance is used to replace or restore an asset at a regular interval. But is such maintenance applicable and if so what is that interval? To answer that, we must examine how the asset (or function) ages.
Frequency Of Failure
If we are to schedule preventative maintenance, it is useful to know how frequently the asset fails. In RCM, we have 2 key metrics for the frequency of failure:
- MTBF: Mean time between failures. The average time between each asset failure. For a fleet of assets, the mean can be taken across all assets in the fleet.
- MTTF: Mean time to failure. The average life of an asset - the average time from installation (or start of life) to failure. Usually used on lifed items such as cured rubber hoses.
With both of the above, it is important to calculate the mean for a given failure mode, not across the entire asset. An asset may fail for many different reasons (why we do a FMEA) - the MTBF and MTTF must be failure mode specific to be of use.
The Gambler's Fallacy
It is common knowledge that things age. As time passes, components wear, structures fatigue, metals corrode and organics degrade. We've all heard of the unstoppable march of entropy and its destructive effects. Even your accountants grasp this; your expensive assets depreciate over time.
But do we overplay this common knowledge? Can we learn from common misconceptions about probability?
A fair casino roulette wheel has a 50% chance of coming up red and 50% black (let's ignore the greens). An experienced gambler will tell you that you almost never get 8 reds in a row. And they are correct, the odds are well against it - the probability is just 0.0547. So if you see a table provide 7 reds in a row, you know to bet on black - it's a sure bet!
Of course, the next roll is still 50%, the table has no memory. It is important to avoid the Gambler's Fallacy with scheduled maintenance. An experienced maintainer may have replaced hundreds of valves in their career. They have never seen a valve reach 10 years of life. So we should replace all valves that survive to 9 years? If the MTBF is 5 years, does that give us the schedule interval?
Well it depends - it depends on how the asset ages. As the asset ages, does it increase the likelihood of failure? Experience often leads us to think that it does, but analysis does not always bear this out. Most complex equipment does not see a significant increase in failure probability as it ages.
Early-life Failure
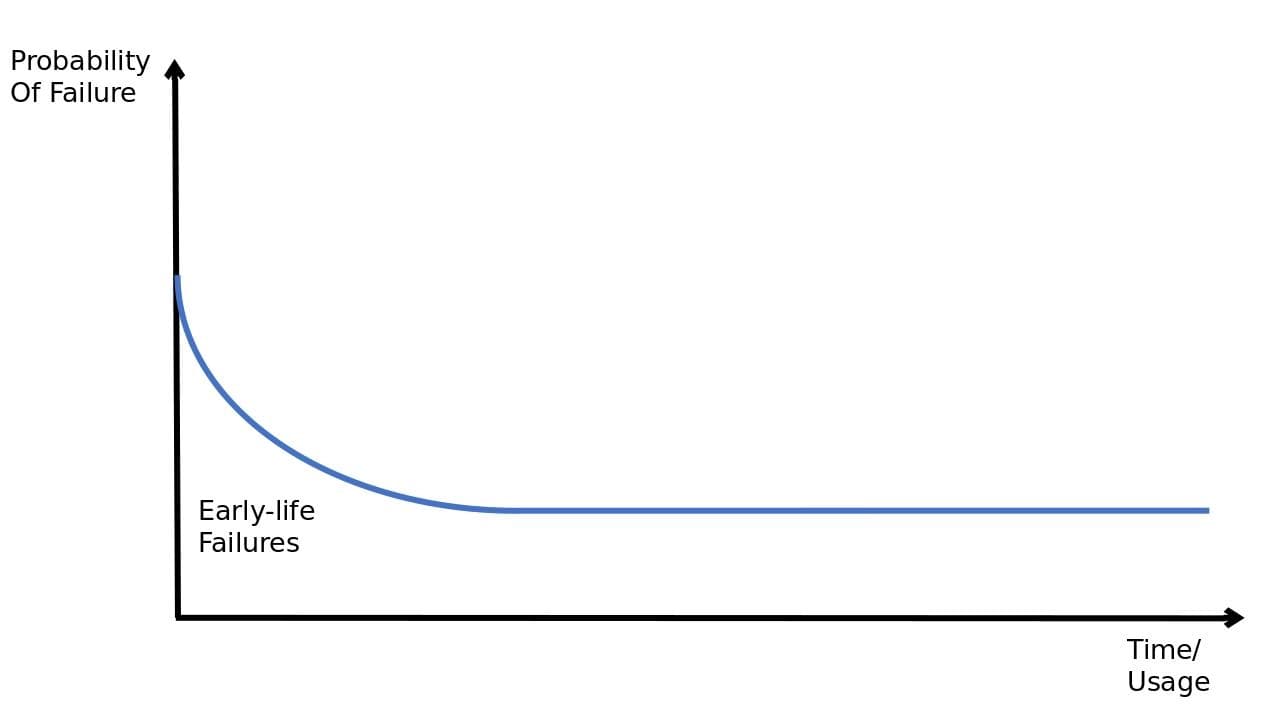
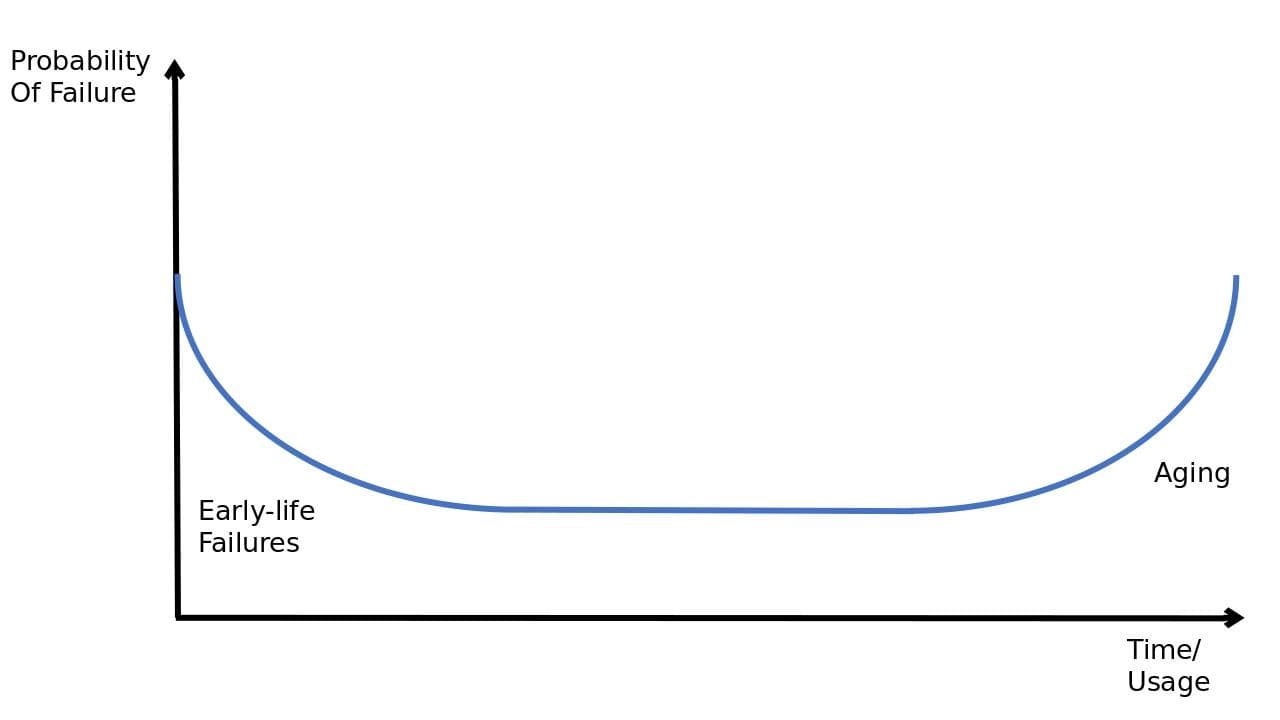
Not only does a lot of complex equipment not see an increase in failure probability over time, many items do see an increase of failure probability at the start of their life or after a restoration task - early-life failures. This could be due to manufacturing issues, transport damage or installation problems.
Failure Patterns
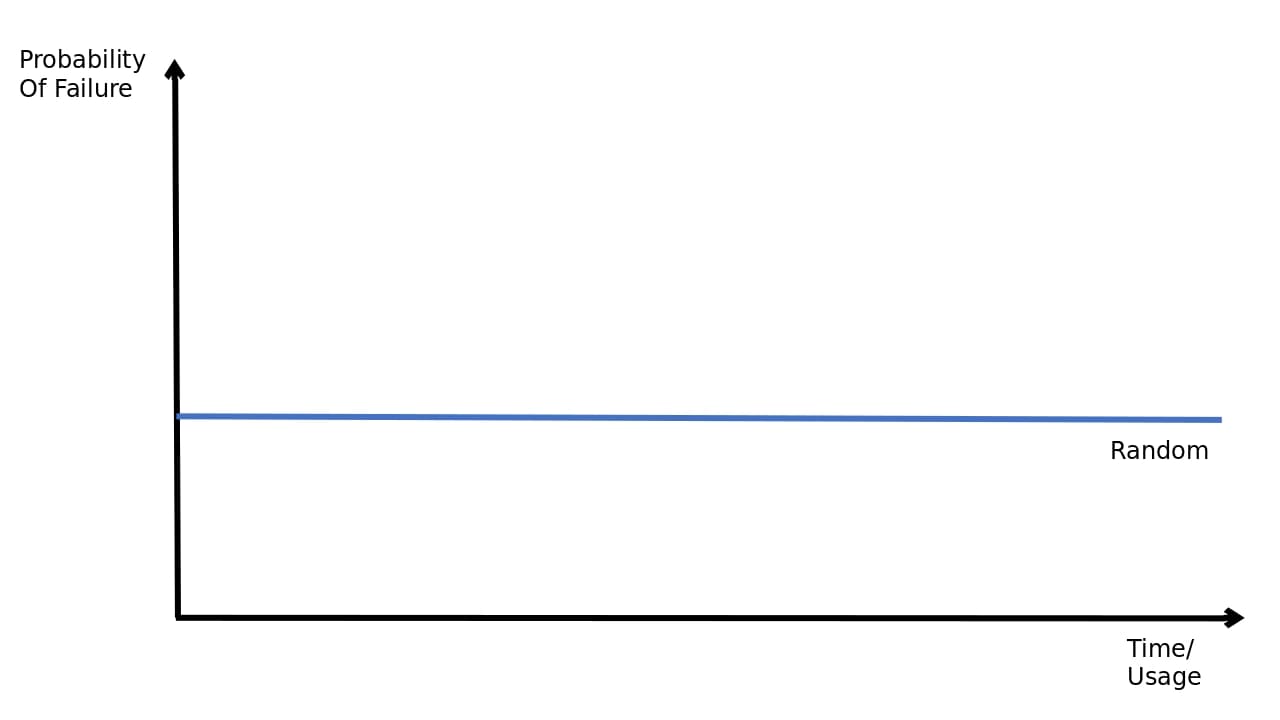
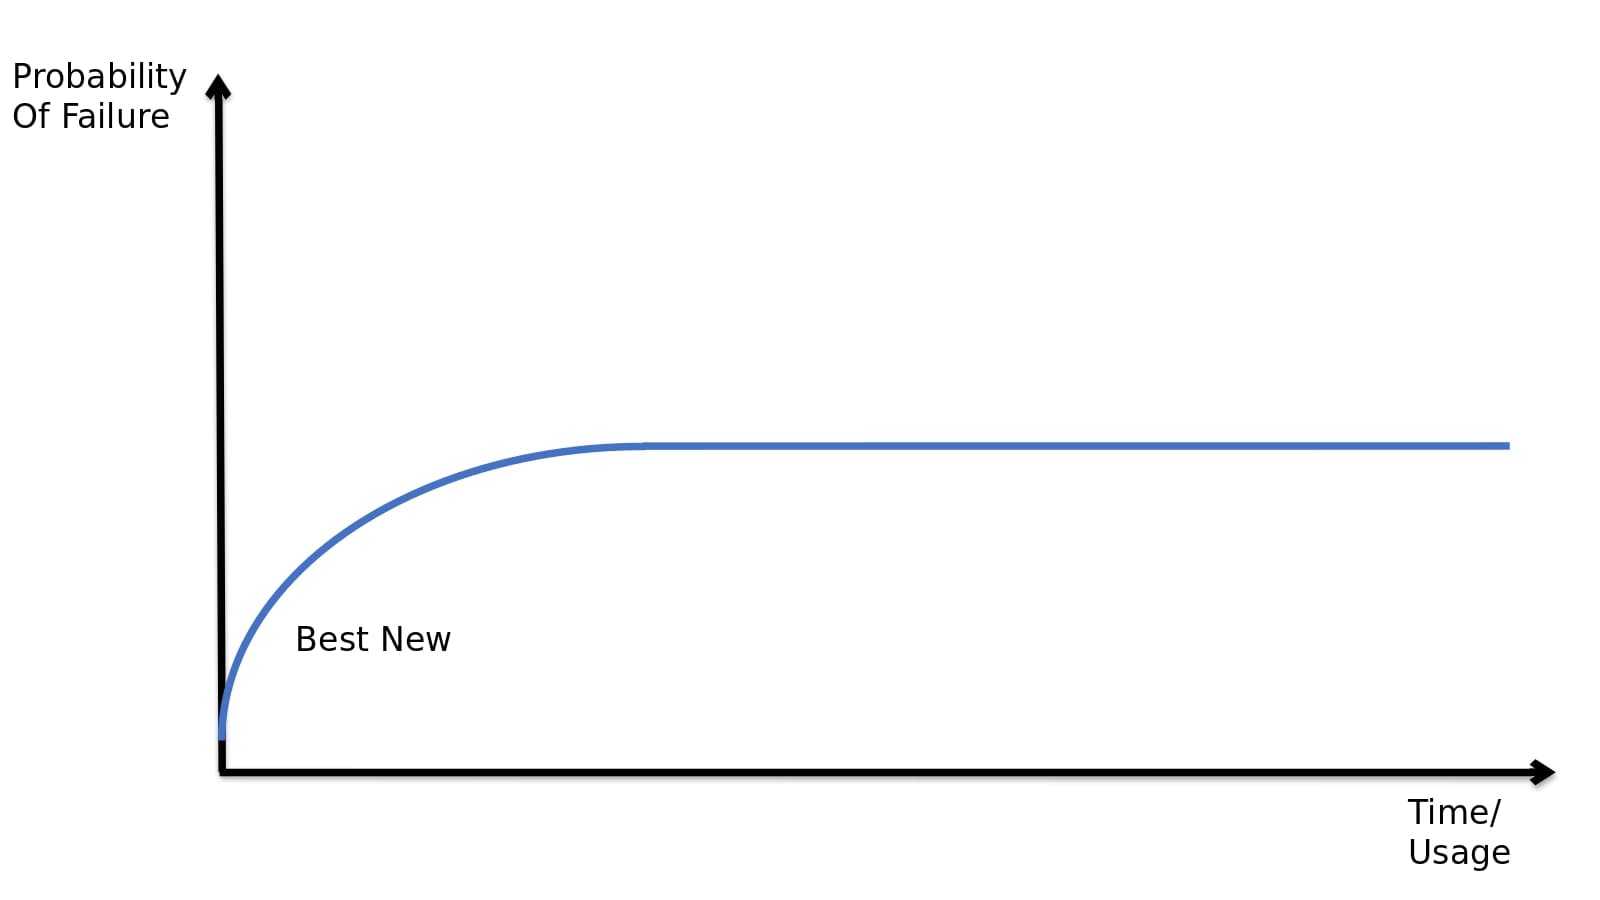
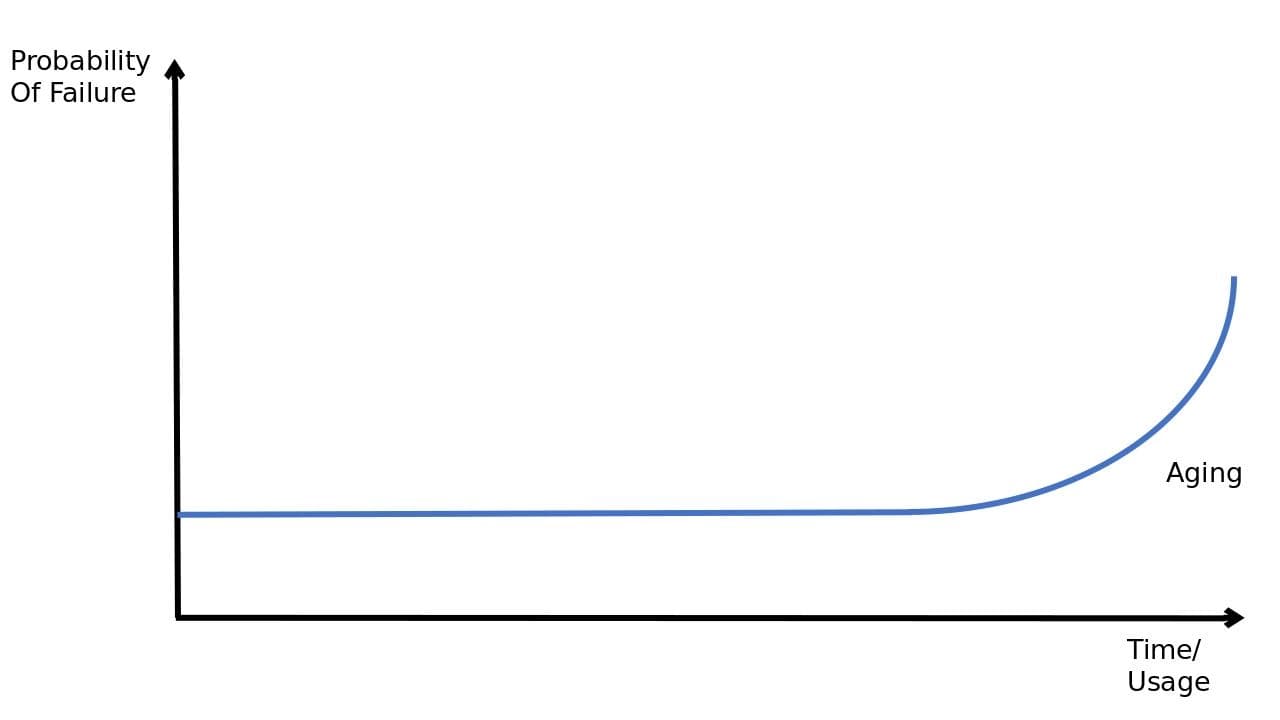
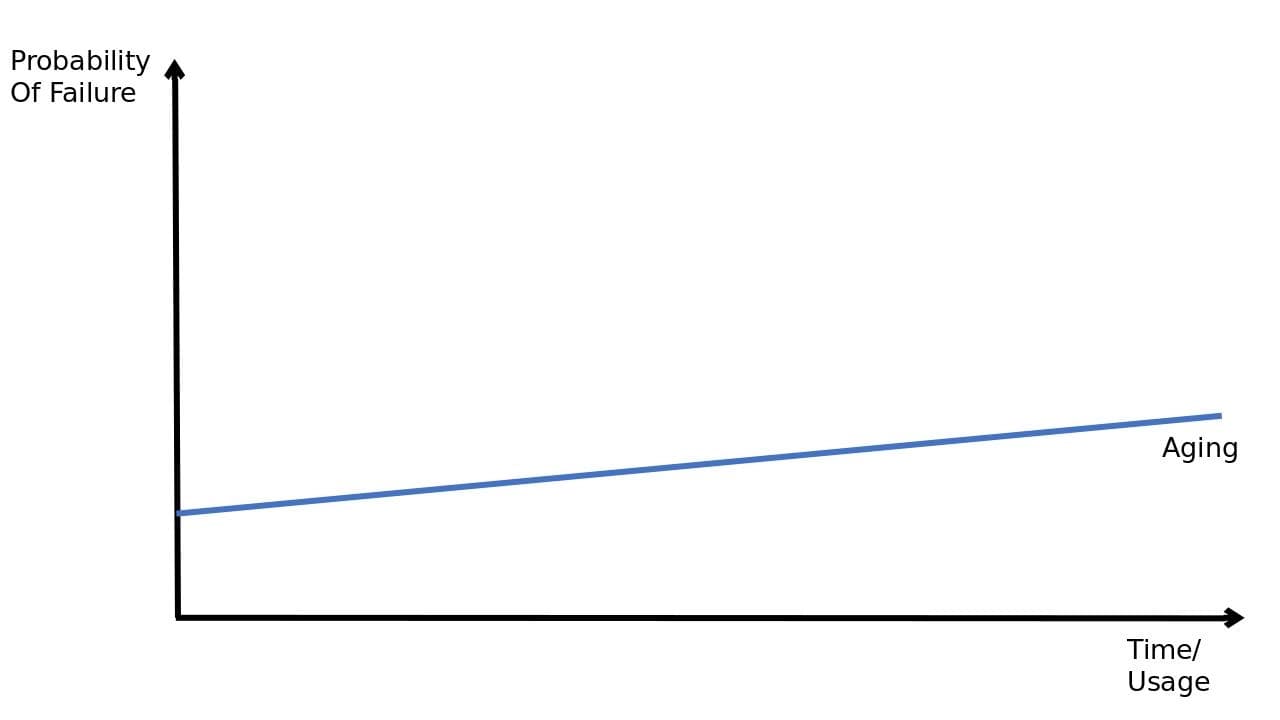
To determine if an asset requires preventative maintenance and what the schedule interval must be, we need to understand the asset's (function's) failure pattern. These patterns map the probability of failure in a given time period against the age or use of the asset. For assets that do not age (do not see an increase in probability of failure over time), we will get a simple flat line. Some assets will have very low probability of failure in their early years, Others will suffer early-life failures, which show as high probability at the start that reduces over time to a flat line. Asset's that age will see a line that increases over time (either a simple linear increase or often a flat line that suddenly sees exponential growth). Some assets can see early-life failures and aging, showing a graph that looks like a 'bath tub'.
Analysis
We tend to think most assets age, and based on this intuition, we schedule restoration tasks at given intervals. However, most complex equipment does not see a significant increase in failure probability as it ages. We either see a constant probability, or more likely, a high probability in early life that drops off to a constant rate. In such cases, scheduled maintenance is not just an expensive waste of time - it causes failures!
Many organizations still over-maintain via interval-based schedules, partly because of the unintuitive nature of cumulative probabilities, but also because of the scheduling systems most organizations employ. Before computers were commonplace, kanban task cards were used to provide simple maintenance schedules. With the introduction of ERPs and CMMSs, these simple task card schedules were computerized - but not improved. Such computer-based systems can actively encourage scheduled over-maintenance.
Scheduled preventative maintenance should be backed up by an age exploration that proves an increase in failure likelihood as the asset ages. Many current maintenance schedules would benefit by moving scheduled preventative maintenance to on-condition (inspection) tasks or run-to-failure strategies.
Experience only provides hypothesis, without data and analysis!